Inhaltsverzeichnis
The Function Table - Window
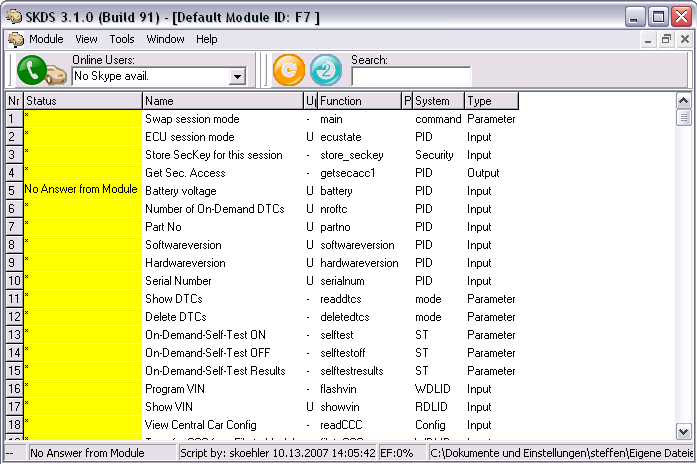
This is the main window of SKDS, one for each module. It contains all the cells to control the module:
The Function table
In this table all available functions are listed. Each row contains the following columns:
- Status: Here the result of the executed function is shown. The result is the outcome of the related function, which was executed inside the Script-interpreter of SKDS. The result is mostly a feedback from a module request, but it can also be anything else which the script can generate as Text-string. This update can be made with a double click into this cell, by the F9-Key or with one of the functions decribed under Update Table Support
- Name This cell describes the function in words
- Update This cell shows, under which conditions the status cell will be updated:
- '-' Only with a manual update
- 'U' With a click on the 'Update List'-Button
- 'T' Regular when the Update-Timer is active
- 'L' Like 'T', but these row is also writen into the log window, if its value changes
A manual Update can always be done, also when T or U are selected. The value of this cell can be changed with a double click
- Function: This cell shows the name of the function which is executed by the script-interpreter when the 'Status'-cell of these rows should be updated
- Process: This cell is more or less only for internal usage, but it also shows which rows are actually waiting for an update.
- System: This cell shows the name of the system to which this function belongs
- Type: This cell shows the type (Input (read Only), Output (Write only) or Parameter (Read and Write) of this function
The Statusbar
The Statusbar provides the following information:
- The operational state of the module (after a first state related command has been executed)
- The result of the last data exchange with the module
- The author and the modification date of the actual script
- The percentage rate of Errorframes of the last received telegram
- The source file name.
Update Table Support
Update List
 By using this button, all cells which are marked for common update are updated. If clicked with the Right Mouse Button, a permanent Update is activated, so all values marked with „U“ are permanently refreshed
Timer-Update
Hotkeys
After setting the focus into the table by clicking with the mouse into it, the following hotkeys can be used:
- F7 : Optimize grid size
- F9,<ENTER> : Update actual row and move the cursor one row down
- u : Set the actual update mode to „U“ and move the cursor one row down
- U : Update all rows marked with the „U“ update mode
- t,T : Set the actual update mode to „T“ and move the cursor one row down
- <space> : Set the actual update mode to „nothing“ and move the cursor one row down
- STRG+r,R : Reload actual file
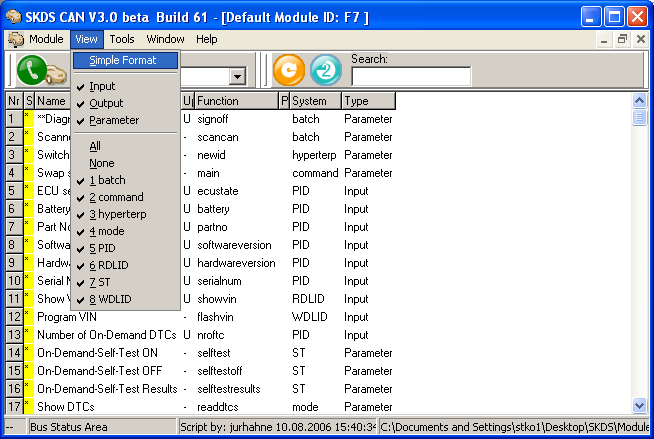
Show and Hide Groups
- All By using this button, all functions in the function table will be shown
- None By using this button, all functions in the function table will be hidden
- Toggle Systems This selection box allows to show or hide function groups in the function table.
You can select any of the several system groups which are listed in the function table. If you select a system, which is currently shown, all cells with this system get hidden. And also the other way round: If a system has just been hidden, it can be made visible again by selecting it in this box.
- Hide Types By using this selection, only the selected type of functions will remain in the function table, all the other ones get hidden. This is especially useful if you want to see for example, only inputs
Menu Functions
Module
The 'normal' functions to load the module files
View
- Optimal Sizes This function can also be selected with the F7-Key. It calculates the width of all columns for optimal size
- Outputs only This function hides all columns which are normally not used during the normal testing
Tools
- Show Telegrams This function opens a log window for the telegrams of the actual module (V1-2)
- Stop Script With this the Script-interpreter can be suspended, if the program was for example, just trapped in an endless-loop due to a programming fault
- Show Bus-traffic The Bus traffic shows a window in which each telegram on the bus can be seen and logged
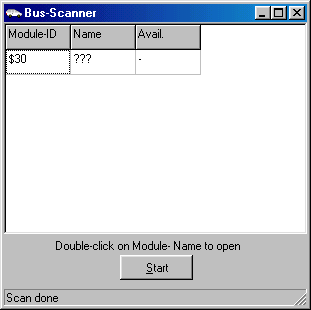
- Scanner The Scanner function opens a window in which the complete Bus address range can be searched through for connected modules
- Errormeter The Errormeter shows in a little gauge the percentage of error frames on the bus. Helpful to identify hardware problems on the bus.
Window
To arrange the open windows
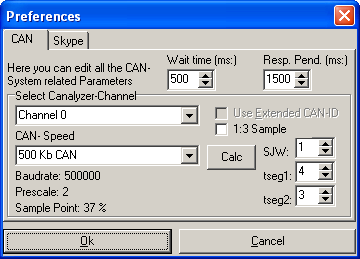
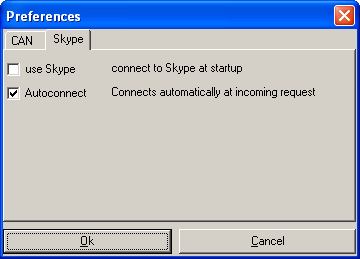
Preferences
This menu item opens a window, in which the program settings, like for the CAN-Driver and for Skype, can be changed
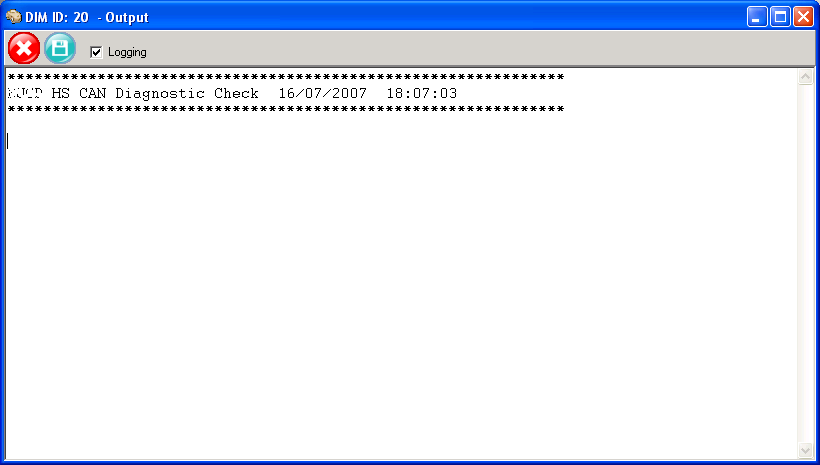
Log-Window
The Log-Windows are used for the following functions:
- Bussniffer (Bus-traffc)
- Telegram-debugging
- Script-Outputs
- Logging of changing values, if the update timer is active and the 'L' update mode is selected in a row
In this windows the outputs of the above functions are shown. The window offers the following functions:
- Logging with this checkmark the recording can be paused
The recording capacity is limited to 1000 lines, all former lines will be deleted
Scanner
With this function a window can be opened, in which the complete Module ID range can be scanned. When the Start Button is pressed, SKDS sends a tester present message to each ID and waits for an answer.
- If a module answers this request, its ID is listed in the Scanner-Window
- If a module answers the request, SKDS requests the Module Part-No. base via the Request Parameter by PID E217. If the module answers this request, the Module part No. will also be shown
- If a module-file with the same name as the module-base name is available in the default module directory, this is also indicated in the scanner-window
- If a module-file is available, this module can be directly opened with a double click on that row in the scanner window
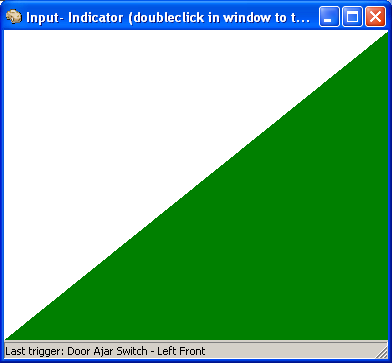
Indicator
This function opens a seperate window, which than changes its colors and picture each time when a timer read input value is changing. It also gives an audible signal.
This is very helpful if the user changes some input signals away from the laptop, where SKDS is running, to see and hear from far that the input signal change is recognized by the module.
Errormeter
This opens a little window, which permanently send Tester present broadcasts. While that the actual error frame rate is displayed in a gauge like a multimeter. This can be used to identify hardware problems of the bus.
Skype Remote Diagnostics
If Skype is available, SKDS can be connected to another SKDS instance running anywhere in the world by using the call button. If the other users grants access, SKDS send and receive all diagnostic telegrams from the modules connected on the other side.
